
What is my maintenance calories? It’s the number of calories you’d eat each day to keep your weight steady, and a formula can only estimate it. The real number comes from eating a steady amount for two to three weeks and watching your weekly average weight.
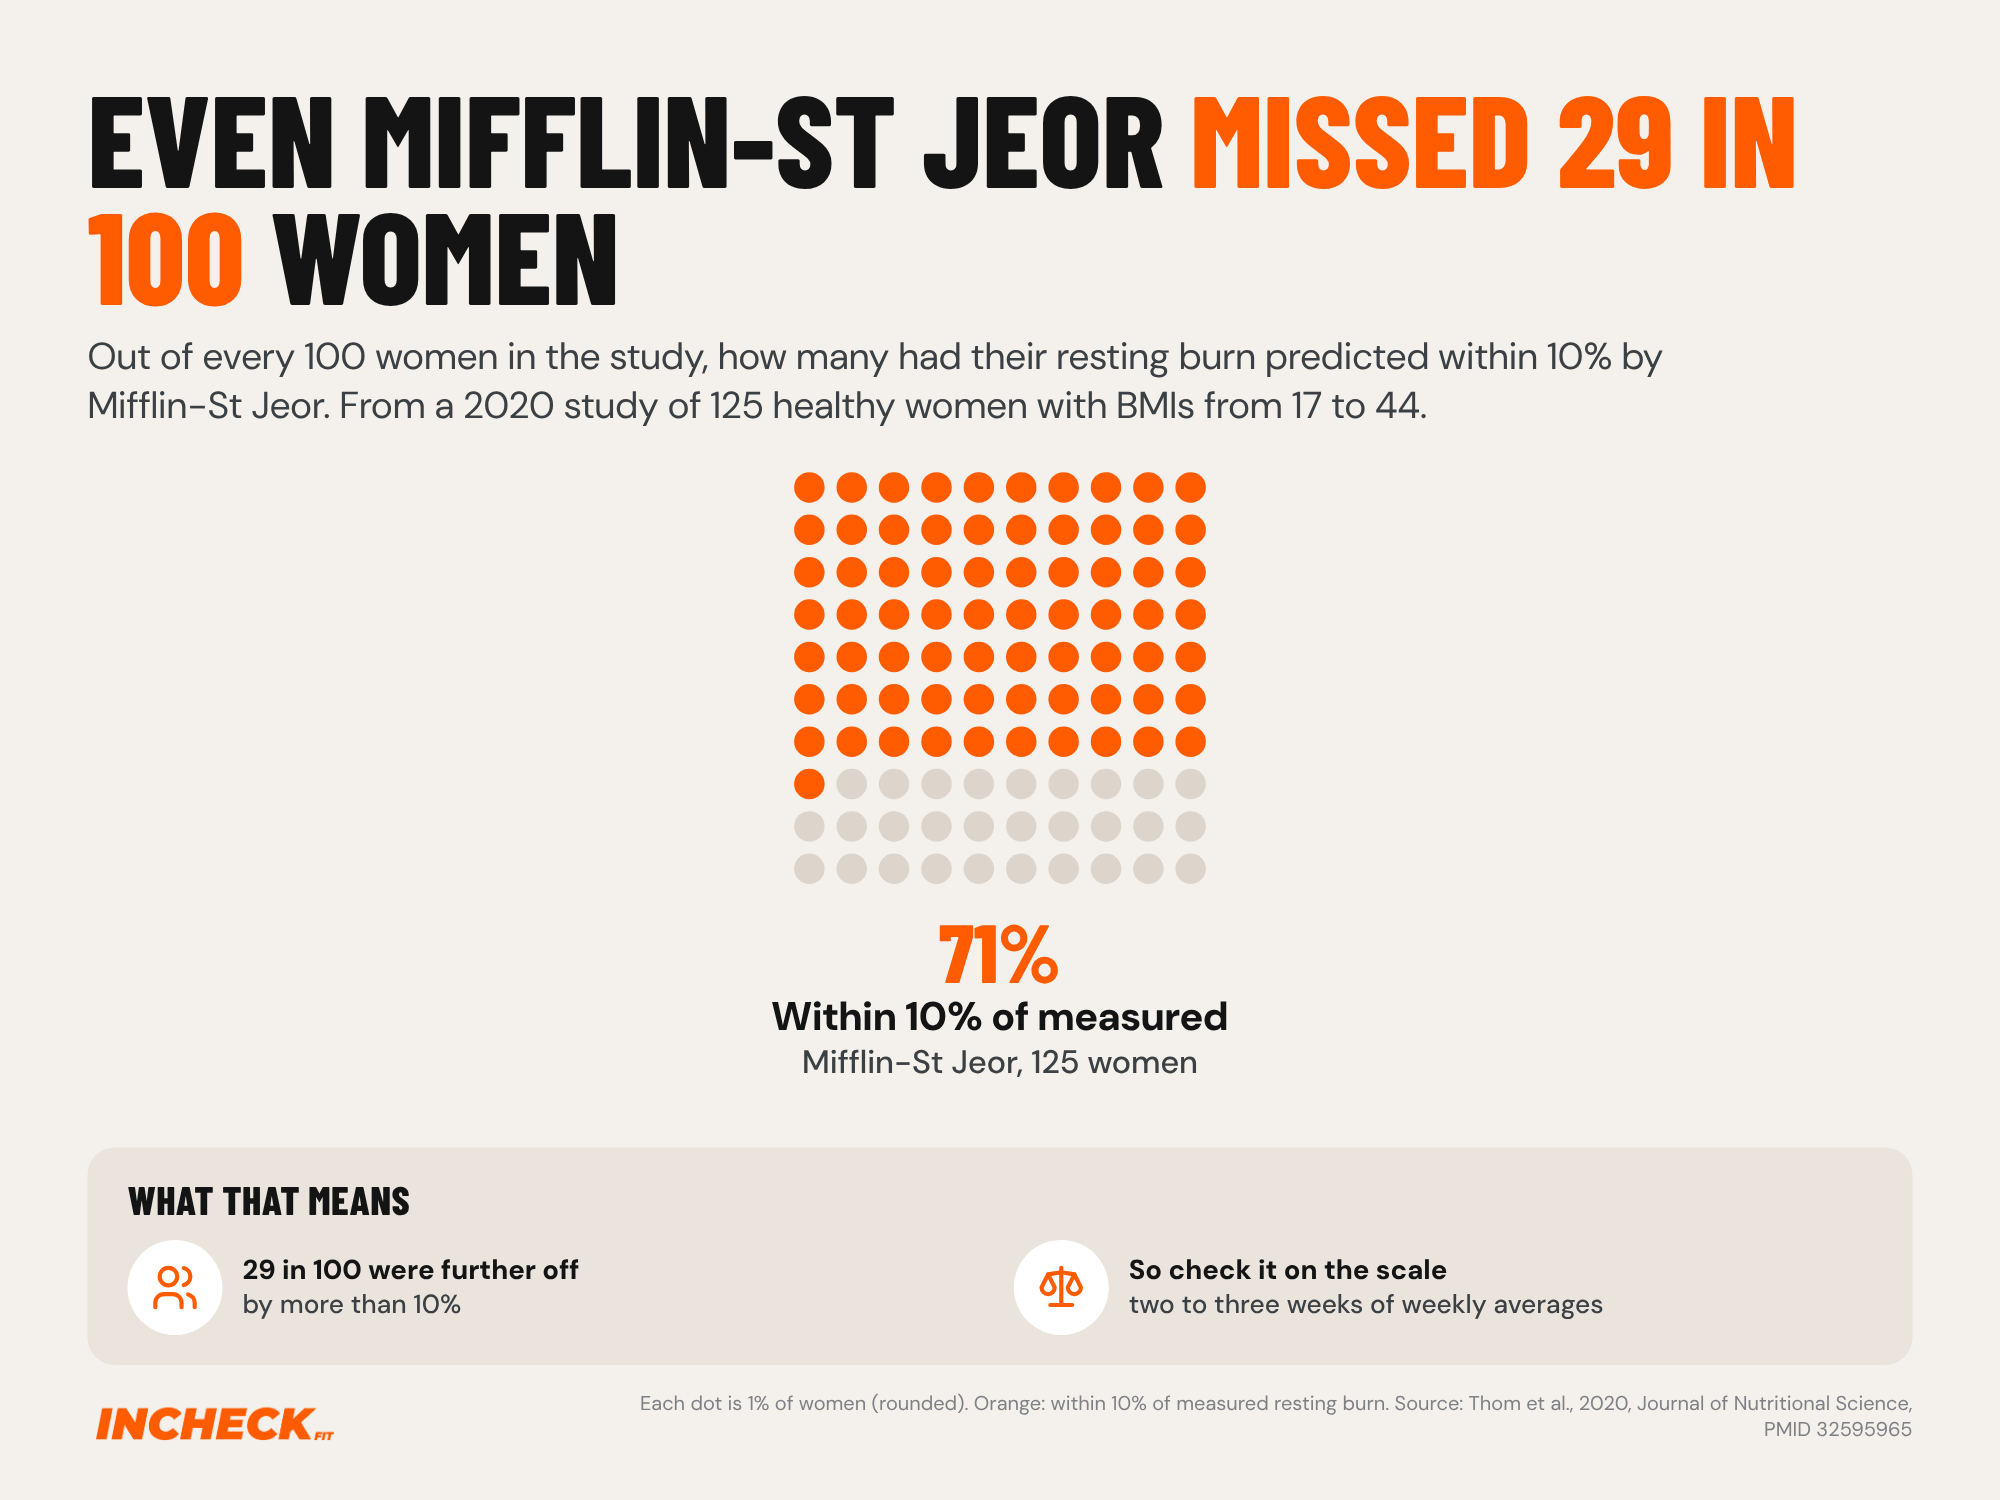
That second step matters, because even the best-tested formula misses some people. In a study of 125 healthy women, the formula with the best hit rate (Mifflin-St Jeor) landed within 10% of their measured resting burn for 71% of them. For the other 29%, it was off by more than 10%.
So treat the calculator number as your starting point, not your answer. Below, I’ll show you how to estimate yours, how to check it against your own weight, what changes for Australians reading kilojoules, and what’s realistic for a 70kg person.
How do I calculate my maintenance calories?
You calculate your maintenance calories in two steps. First, estimate your resting burn (what your body uses just to keep you going at rest) from your weight, height, age and sex. Then multiply that by an activity factor (a multiplier for how active you are) that covers your daily movement and training. The result is an estimate. Your weight trend over the next few weeks tells you how close it is.
A well-tested resting formula is the Mifflin-St Jeor equation. It was built in 1990 from measurements of 498 healthy adults aged 19 to 78. They included people of normal weight and people with obesity. A 2005 systematic review of resting formulas found it was the most reliable of the ones compared, in both groups. The same review also warned that “noteworthy errors” remain when any formula is applied to one person.
Here’s the formula:
- Women: (10 x weight in kg) + (6.25 x height in cm) - (5 x age) - 161
- Men: (10 x weight in kg) + (6.25 x height in cm) - (5 x age) + 5
Take a 30-year-old woman who is 165cm and 70kg. Her estimated resting burn is about 1,420 calories a day. She works at a desk and trains a few times a week, so an activity factor of about 1.55 is a reasonable starting guess. That gives an estimated maintenance of about 2,200 calories a day.
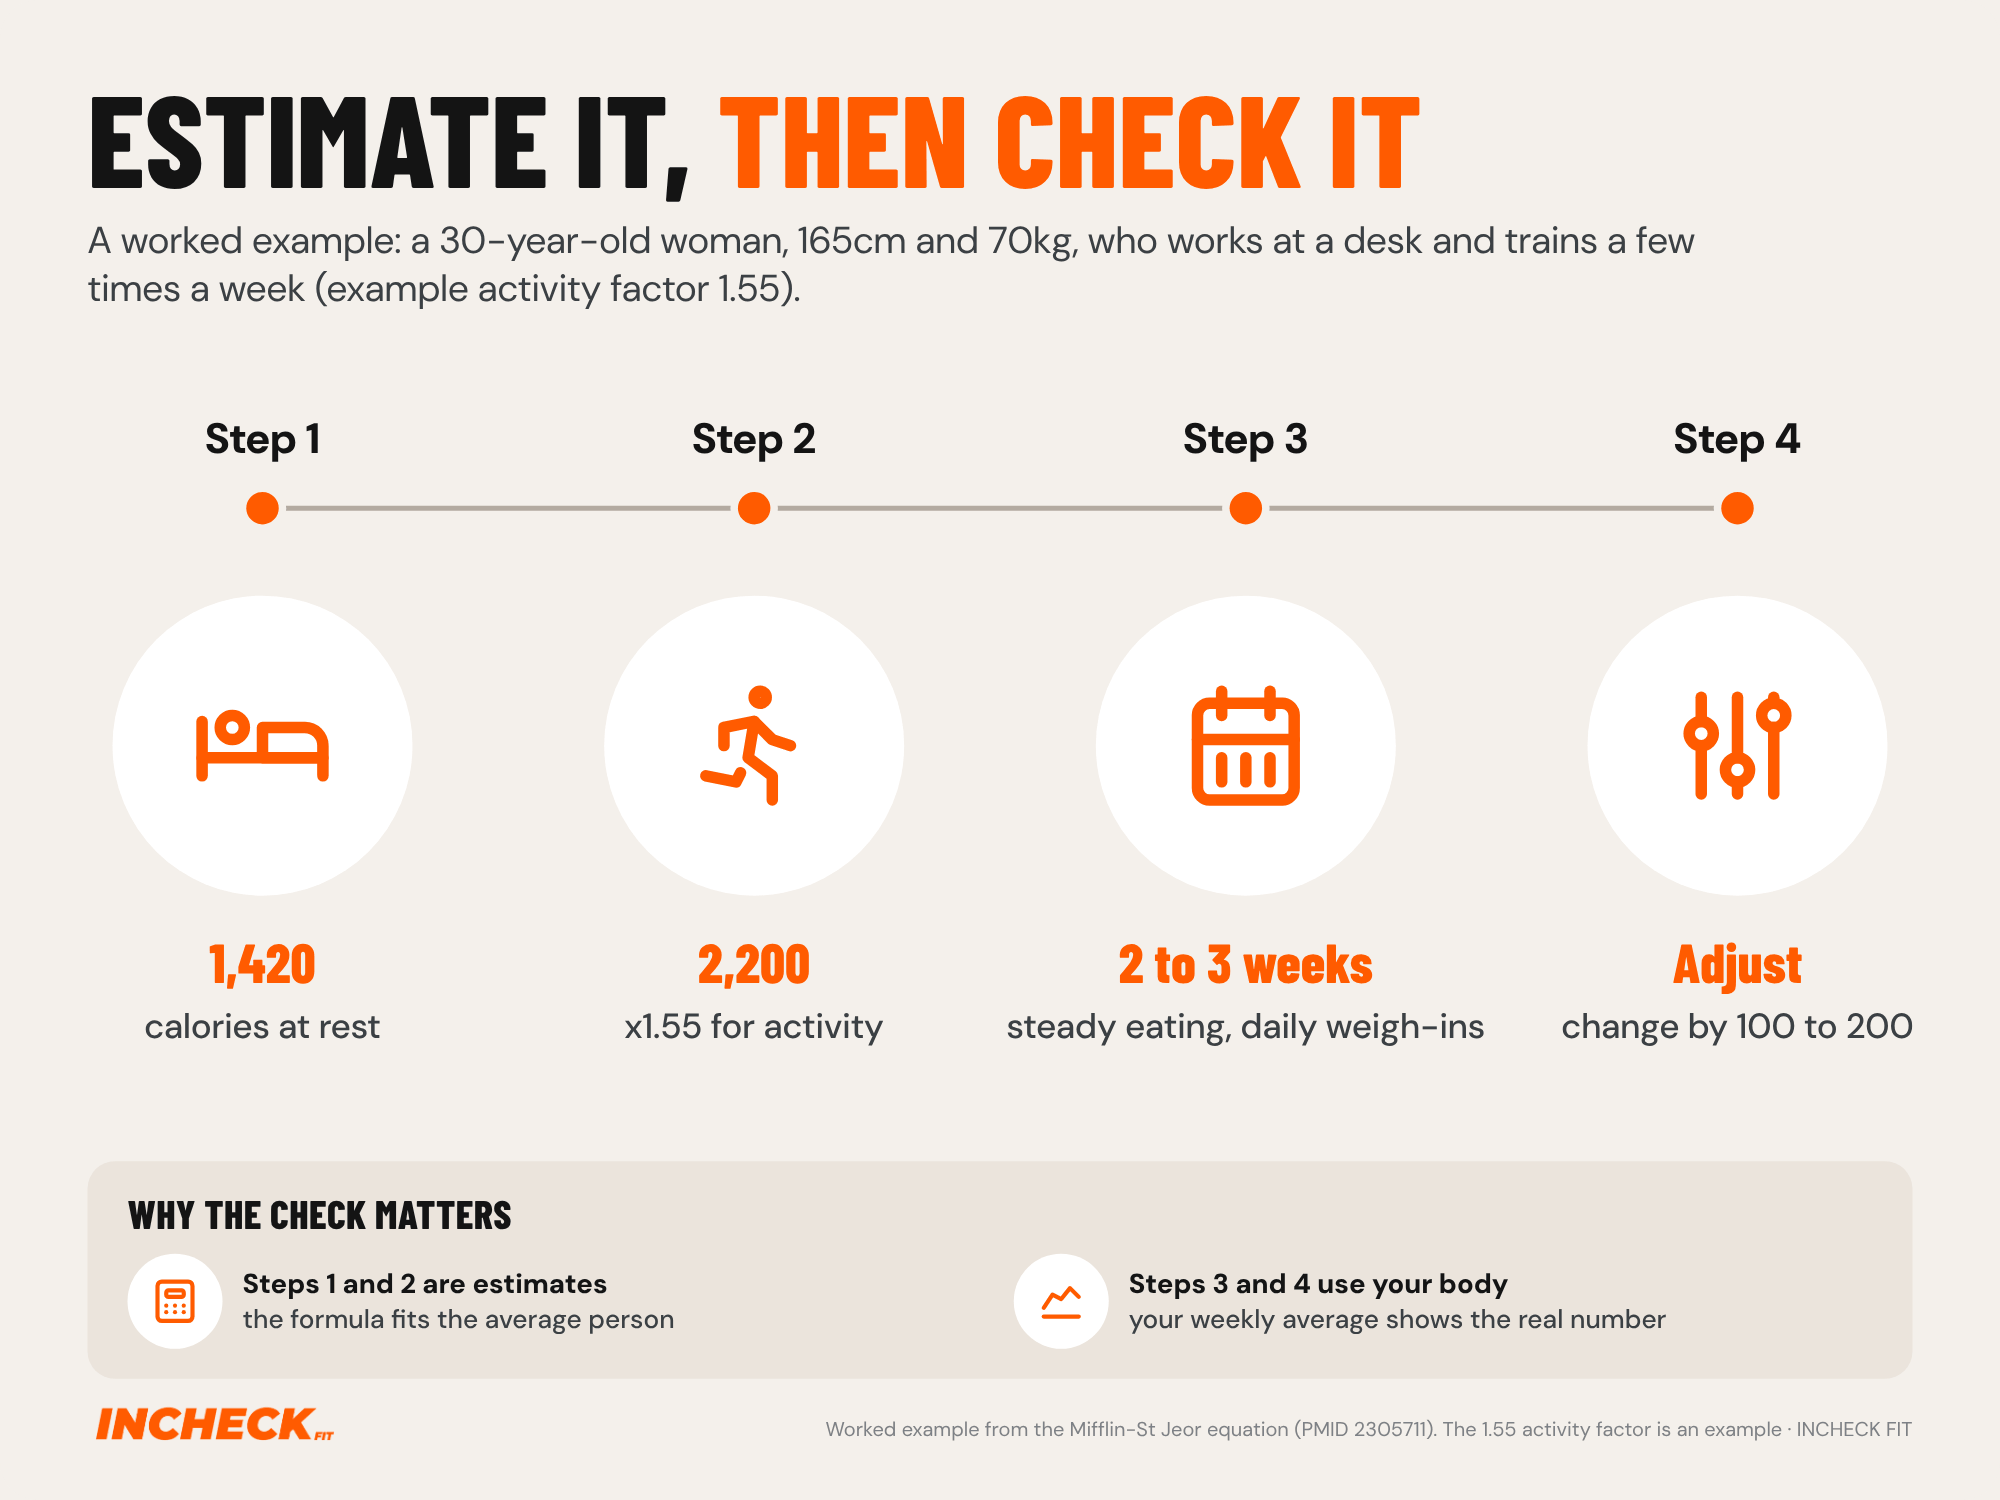
The activity factor is where most of the guesswork sits. Australia’s national energy guidelines list activity levels from 1.4 to 1.5 for office workers, up to 2.0 to 2.4 for heavy physical work or high-performance athletes. They also say to add extra for significant sport. Picking 1.55 instead of 1.7 moves this example by about 210 calories a day.
If you’d rather skip the arithmetic, our calorie calculator does both steps for you and shows your maintenance alongside fat loss and muscle gain targets.
Why your calculator number is only an estimate
A formula predicts the average person with your stats. You are one person, and people with the same age, sex, size and activity can burn quite different amounts.
That shows up when formulas are tested against measurements:
- Resting burn: in that study of 125 healthy women with a wide range of body sizes, Mifflin-St Jeor came within 10% of their measured resting burn for 71% of them. It had the best hit rate of the formulas tested, and it still missed by more than 10% for 29% of the women.
- Total daily burn: in a 2024 study of 56 adults with a range of activity levels, formulas for total daily burn generally came in under what was measured. The measurement used doubly labelled water, a lab method that measures total daily burn during normal life. For individuals, the errors were sizeable.
- Athletes: a 2023 review of 29 studies in 1,430 adult athletes found Mifflin-St Jeor was among the formulas that misjudged their resting burn.
Australia’s own guidelines say the same thing in plainer terms. Their energy estimates “are only approximate, especially for individuals”, partly because everyday movement like fidgeting adds a lot for some people and very little for others.
This isn’t a reason to ignore the formula. It’s a reason to check it.
How to check your maintenance calories against your weight
Our take: the most practical way to find your maintenance at home is to let your body tell you. Eat close to your estimate, keep it steady, and see what your weight does.
The idea has a scientific basis. In a 2014 controlled overfeeding study, researchers estimated how much people had eaten from measured changes in their body’s energy stores (fat, muscle and stored carbohydrate), without relying on food records. In the inpatient part of the study, that estimate came within 0.2% of what people actually ate on average. For individuals, the likely range was roughly 380 calories a day either way. Our take: your weight trend works on a similar idea. Over enough time, it shows whether you’re eating above, below or close to what you burn.
Here’s how I’d run it:
- Pick your starting number. Use the formula or our calculator.
- Eat close to it every day for 2 to 3 weeks. Consistency matters more than perfection. Weekends count too.
- Weigh in each morning, after the bathroom and before you eat or drink.
- Ignore single days. Compare weekly averages. Add up the week’s weigh-ins and divide by the number of days.
- Adjust in small steps. If the weekly average is climbing, come down 100 to 200 calories. If it’s falling, go up by the same. Then give it another two to three weeks.
Our take: ignore the first few days after you change your intake. Changes in food, salt and stored carbohydrate shift water quickly, so the scale moves before your body fat does.
Why single weigh-ins mislead you
Your weight moves around every day even when nothing real is changing. In a European weight loss maintenance programme, 1,421 adults weighed themselves on smart scales. Their weight swung by about 0.35% within the week, rising at the weekend and falling during the week. For a 70kg person, that’s about 0.25kg. A smaller study of 80 adults found the same pattern: higher on Sunday and Monday, then drifting down. The authors wrote that this weekend-to-weekday swing “should be considered as normal.”
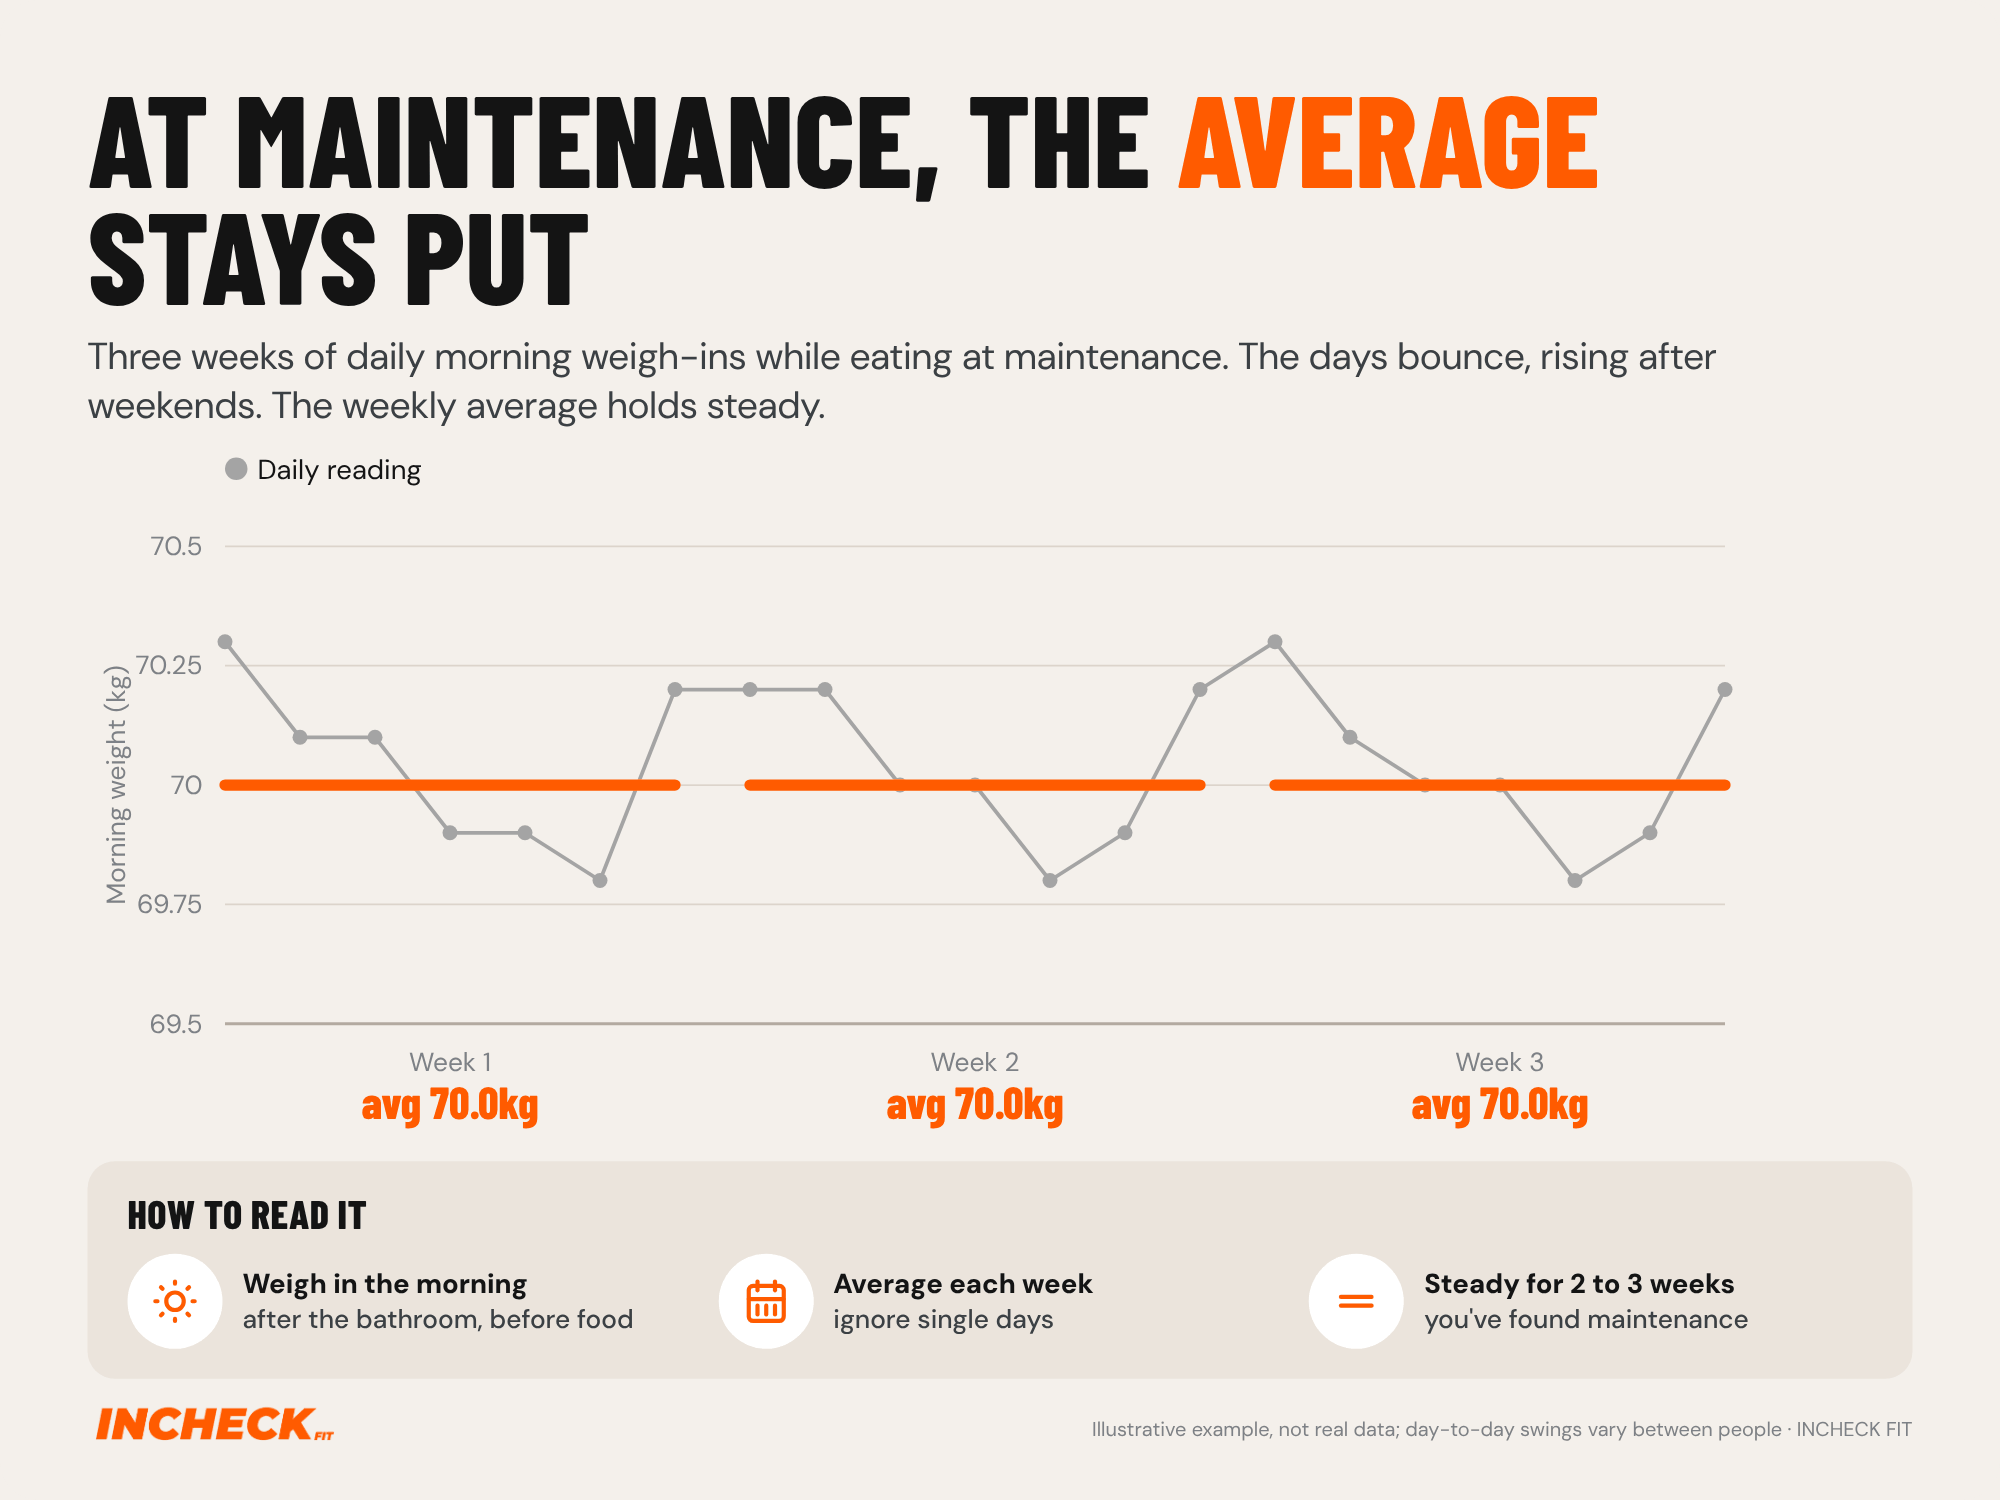
That’s why one heavy Monday doesn’t tell you much on its own. If your weekly average holds roughly steady for two to three weeks, you’ve found your maintenance. For more on what moves the scale overnight, see why your weight went up overnight.
Turning a drift into a number
If your weekly average keeps moving, you can roughly convert it into calories. A common rule of thumb says a kilo of body weight is worth about 7,700 calories. A 2008 analysis showed that rule is only an approximation. It roughly fits people starting with more than about 30kg of body fat, and it overstates the calories behind each kilo lost for people with less body fat.
So use it loosely. As a rough guide, a weekly average that keeps falling by about 0.25kg, week after week, suggests you’re eating somewhere around 250 to 300 calories a day below maintenance. Rather than chasing a precise figure, adjust by 100 to 200 calories and check again in two to three weeks.
Why tracking alone can’t settle it
If you track your food, it’s tempting to trust the app’s total over the scale. The trouble is that people tend to undercount. In a 2003 study of 484 adults aged 40 to 69, people recalled everything they’d eaten the day before. Men reported 12% to 14% less energy than they actually burned, and women 16% to 20% less, measured with doubly labelled water. Our take: that isn’t people lying. Portions, oils, sauces and drinks are genuinely hard to estimate.
That’s why your weight trend has the final say. If your tracked intake says maintenance but your weekly average is climbing, the scale is the more reliable of the two.
This is the same logic INCHECK FIT uses. Your weekly check-in reviews your progress, using the weight and measurements you log, and adjusts your calorie and macro targets for the following week. That way the starting estimate keeps getting corrected by what your body is actually doing.
How to work out maintenance calories in Australia?
In Australia, you work out maintenance calories the same way, but food labels and official calculators use kilojoules. To convert, divide kilojoules by 4.18 to get calories, which is the figure Australia’s Nutrient Reference Values use. The government’s Eat For Health calculator estimates your daily energy needs in kilojoules, with activity levels from 1.2 to 2.2.
A few things worth knowing:
- Labels: Australian nutrition panels show energy in kilojoules, sometimes with calories alongside. A 2,000-calorie day is about 8,360 kJ.
- The 8,700 kJ on labels isn’t your number. It’s the reference “average adult diet” used to work out the % daily intake on packaging, about 2,080 calories. Your maintenance could be well above or below it.
- The official tables. Australia’s guidelines estimate energy needs as a resting estimate (from the Schofield equations) multiplied by an activity level, the same two steps as above. They suggest activity levels of 1.4 to 1.5 for office workers, 1.6 to 1.7 for students, drivers and lab assistants, and 1.8 to 1.9 for domestic duties, salespeople, waiters and mechanics.
The Eat For Health calculator is a good free starting point. Like every formula, it’s an estimate, so check it against your weight the same way.
How many calories does a 70 kg person need?
Australia’s guidelines don’t list 70kg exactly. For a 71.3kg adult who is 1.8m tall and aged 19 to 30, they estimate roughly 2,150 to 3,180 calories a day, depending on sex and activity level. That’s about 2,150 to 2,780 for a woman and 2,460 to 3,180 for a man, from office work to jobs on your feet.
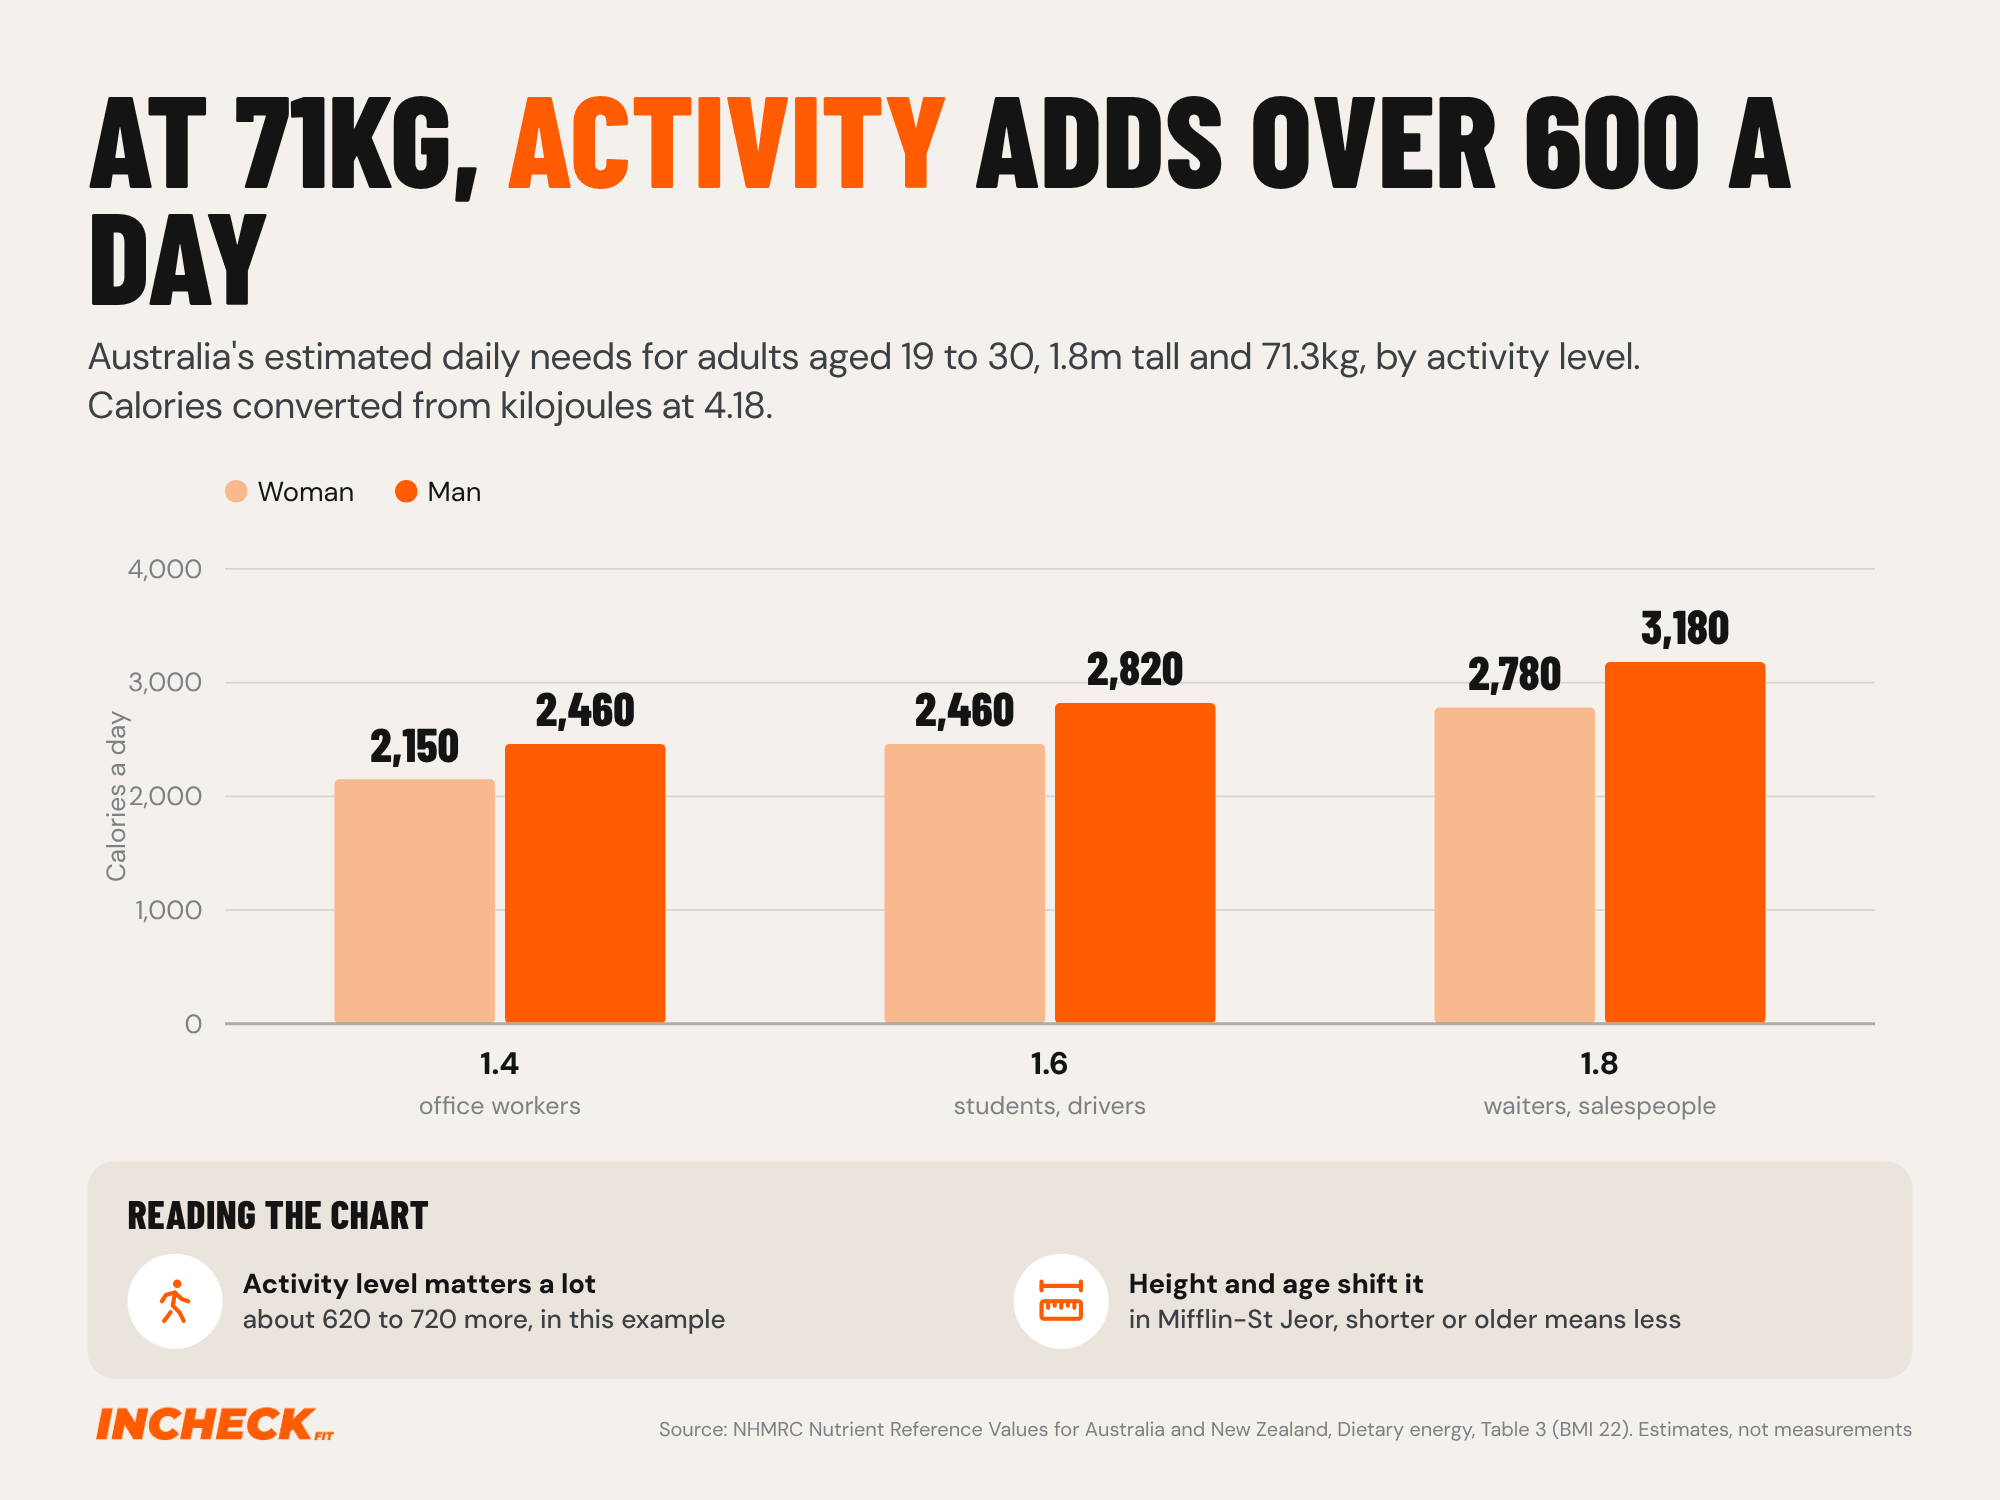
Those figures come from the national tables, which list needs in megajoules (thousands of kilojoules). They show how much activity matters. In that example, moving from office work to a job on your feet adds over 600 calories a day for the woman and over 700 for the man.
Height and age change it too. In the Mifflin-St Jeor formula, each centimetre shorter lowers the resting estimate by about 6 calories a day, and each extra year lowers it by 5. Use these as a sense of the range, then find your own number with the steps above.
What changes your maintenance over time
Your maintenance isn’t fixed. It moves when the things that drive it move:
- Your weight. A smaller body burns less. After you lose weight in a calorie deficit, your maintenance will be lower than it was before, so re-check it rather than going back to your old number. Our guide to reverse dieting covers how to step back up after a diet.
- Your activity. A new job, more steps or more training changes the activity factor. A lean bulk starts from maintenance too, so it’s worth knowing it before you add a surplus.
- Your training numbers. If your target already includes your training, adding your watch’s calories on top counts the same workout twice. Our article on eating back exercise calories explains why.
Our take: re-check your maintenance whenever your weight or routine has changed noticeably, or every few months if you’re holding steady.
FAQ
-
Is my maintenance calories really 3000? It could be, if you’re a larger or more active man. Australia’s guidelines estimate about 2,580 to 3,300 calories a day for a 76kg man aged 19 to 30, from sedentary to moderately active. For many women and less active people, 3,000 would be high. Check it against your weekly average weight before you trust it.
-
Is 1200 calories enough for maintenance? For almost no adult, going by Australia’s national tables. There, the lowest adult estimate is about 1,340 calories a day, for a 1.5m, 49.5kg woman over 70 on bed rest, and every other adult in the table needs more. If your weight seems steady on about 1,200 calories, it’s common for intake to be higher than tracked. That doesn’t mean anyone is lying. If you’ve been eating very little for a long time, or you’re worried about your eating, a GP or Accredited Practising Dietitian can help you work out what’s going on.
-
How long does it take to find my maintenance calories? Usually two to three weeks of steady eating. Ignore the first few days after a change, because water shifts move the scale quickly. Then compare weekly averages: if they hold roughly steady, you’ve found it.
-
Are maintenance calories the same as TDEE? Yes, in practice. TDEE (total daily energy expenditure) is what you burn in a day, and maintenance is eating that same amount. Calculators estimate it, while your weight trend shows the real figure.
-
What’s the best calculator for maintenance calories? No calculator knows your exact number. In a 2005 review, Mifflin-St Jeor was the most reliable of the resting formulas compared. In a study of 125 healthy women, it was within 10% of measured resting burn for 71% of them. Any reputable calculator, including ours, is a fine starting point if you check it against your weight.
-
Should I weigh myself every day to find maintenance? Daily weigh-ins work well if you use the weekly average and ignore single days. Among 1,421 adults in a weight loss maintenance programme, weight swung by about 0.35% within the week, up at the weekend and down during the week, so one heavy Monday isn’t a trend.
References
-
Mifflin MD, St Jeor ST, Hill LA, Scott BJ, Daugherty SA, Koh YO. A new predictive equation for resting energy expenditure in healthy individuals. American Journal of Clinical Nutrition. 1990;51(2):241-247. PMID: 2305711. DOI: 10.1093/ajcn/51.2.241. [Equation development study, human, n=498 healthy adults aged 19 to 78 (247 women, 251 men; 264 normal weight, 234 with obesity). Abstract verified 16 Nov 2026 via Europe PMC; corrections checked, none found.]
-
Frankenfield D, Roth-Yousey L, Compher C. Comparison of predictive equations for resting metabolic rate in healthy nonobese and obese adults: a systematic review. Journal of the American Dietetic Association. 2005;105(5):775-789. PMID: 15883556. DOI: 10.1016/j.jada.2005.02.005. [Systematic review, human, studies in nonobese and obese adults (total n not stated in abstract). Abstract verified 16 Nov 2026 via Europe PMC; corrections checked, none found.]
-
Thom G, Gerasimidis K, Rizou E, et al. Validity of predictive equations to estimate RMR in females with varying BMI. Journal of Nutritional Science. 2020;9:e17. PMID: 32595965. DOI: 10.1017/jns.2020.11. [Cross-sectional validation, human, n=125 healthy adult women, BMI 17 to 44. Abstract verified 16 Nov 2026 via Europe PMC; an erratum is listed (PMID 32597905), its content not described in the record.]
-
Prado-Nóvoa O, Howard KR, Laskaridou E, et al. Validity of predictive equations for total energy expenditure against doubly labeled water. Scientific Reports. 2024;14(1):15754. PMID: 38977928. DOI: 10.1038/s41598-024-66767-7. [Validation study against doubly labelled water, human, n=56 adults varying in activity level. Abstract verified 16 Nov 2026 via Europe PMC; corrections checked, none found.]
-
O’Neill JER, Corish CA, Horner K, et al. Accuracy of resting metabolic rate prediction equations in athletes: a systematic review with meta-analysis. Sports Medicine. 2023;53(12):2373-2398. PMID: 37632665. DOI: 10.1007/s40279-023-01896-z. [Systematic review and meta-analysis, human, 29 studies, n=1,430 adult athletes. Abstract verified 16 Nov 2026 via Europe PMC; corrections checked, none found.]
-
Gilmore LA, Ravussin E, Bray GA, et al. An objective estimate of energy intake during weight gain using the intake-balance method. American Journal of Clinical Nutrition. 2014;100(3):806-812. PMID: 25057153. DOI: 10.3945/ajcn.114.087122. [Validation within two controlled overfeeding trials (inpatient and outpatient), human, n not stated in abstract. Abstract verified 16 Nov 2026 via Europe PMC; corrections checked, none found.]
-
Turicchi J, O’Driscoll R, Horgan G, et al. Weekly, seasonal and holiday body weight fluctuation patterns among individuals engaged in a European multi-centre behavioural weight loss maintenance intervention. PLoS One. 2020;15(4):e0232152. PMID: 32353079. DOI: 10.1371/journal.pone.0232152. [Secondary analysis of a weight loss maintenance trial (NoHoW) using smart-scale data, human, n=1,421 adults for the weekly analysis. Abstract verified 16 Nov 2026 via Europe PMC; corrections checked, none found.]
-
Orsama AL, Mattila E, Ermes M, et al. Weight rhythms: weight increases during weekends and decreases during weekdays. Obesity Facts. 2014;7(1):36-47. PMID: 24504358. DOI: 10.1159/000356147. [Observational study, human, n=80 adults (BMI 20.0 to 33.5, aged 25 to 62). Abstract verified 16 Nov 2026 via Europe PMC; corrections checked, none found.]
-
Hall KD. What is the required energy deficit per unit weight loss? International Journal of Obesity. 2008;32(3):573-576. PMID: 17848938. DOI: 10.1038/sj.ijo.0803720. [Modelling analysis, human metabolism, no participants. Abstract verified 16 Nov 2026 via Europe PMC; corrections checked, none found.]
-
Subar AF, Kipnis V, Troiano RP, et al. Using intake biomarkers to evaluate the extent of dietary misreporting in a large sample of adults: the OPEN study. American Journal of Epidemiology. 2003;158(1):1-13. PMID: 12835280. DOI: 10.1093/aje/kwg092. [Biomarker validation study using doubly labelled water and urinary nitrogen, human, n=484 men and women aged 40 to 69. Abstract verified 16 Nov 2026 via Europe PMC; corrections checked, none found.]
-
National Health and Medical Research Council. Nutrient Reference Values for Australia and New Zealand: Dietary energy. Eat For Health, updated 12 April 2021. https://www.eatforhealth.gov.au/nutrient-reference-values/nutrients/dietary-energy [Official guideline. Table 3 (adult estimated energy requirements, BMI 22), Table 4 (activity levels, adapted from Black et al 1996), and the conversion “4.18 kilojoules are equal to 1 kilocalorie”. Checked on the NHMRC page 16 Nov 2026.]
-
Food Standards Australia New Zealand. Guidance for Energy Labelling on Alcoholic Beverages. February 2026. https://www.foodstandards.gov.au/sites/default/files/2026-02/Guidance%20for%20Energy%20Labelling%20on%20Alcoholic%20Beverages.pdf [Regulator guidance. “Percentage daily intakes are based on an average adult diet of 8700 kJ.” Checked 16 Nov 2026.]
Last reviewed: November 2026